| Home → Corruption Perceptions Index → Older Indices → 1997 |  |
| Home | |||
| Contact information | |||
| Research Area | |||
| Corruption Perceptions Index | |||
| 2009 and later | 2008 | 2007 | |
| 2006 | |||
| 2005 | |||
| 2004 | |||
| 2003 | |||
| 2002 | |||
| 2001 | |||
| 2000 | |||
| older indices | |||
| childhood days | |||
| Lecture and Workshops |
Index 1997
The index for 1997 presents a list of 52 countries. The index has been prepared as a "poll of polls" using seven sources.
Keep in mind, that all surveys measure corruption by gathering data about the subjective perception of corruption. Note also, that the index does not necessarily reflect our personal opinion.
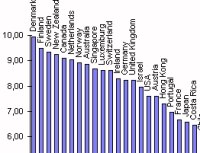
 | We also provide a graphical illustration of the ranking (112kb, jpg). |
Rank reflects the position of a country in comparison to all other countries which were included into the list.
Score-97 relates to perceptions of the degree of corruption as seen by businessmen, risk analysts and the general public and ranges between 10 (clean) and 0 (highly corrupt).
Amount refers to the number of surveys that assessed a country´s performance. 7 surveys were used and at least 4 surveys were required for a country to be included in the 1997 index.
Variance indicates differences in the values of the sources for the 1997 index: the greater the variance, the greater the differences of perceptions of a country among the sources.
| Rank | Country | Score-97 | Amount | Variance |
| 1 | Denmark | 9,94 | 6 | 0,54 |
| 2 | Finland | 9,48 | 6 | 0,3 |
| 3 | Sweden | 9,35 | 6 | 0,27 |
| 4 | New Zealand | 9,23 | 6 | 0,58 |
| 5 | Canada | 9,1 | 5 | 0,27 |
| 6 | Netherlands | 9,03 | 6 | 0,23 |
| 7 | Norway | 8,92 | 6 | 0,51 |
| 8 | Australia | 8,86 | 5 | 0,44 |
| 9 | Singapore | 8,66 | 6 | 2,32 |
| 10 | Luxemburg | 8,61 | 4 | 1,13 |
| 11 | Switzerland | 8,61 | 6 | 0,26 |
| 12 | Ireland | 8,28 | 6 | 1,53 |
| 13 | Germany | 8,23 | 6 | 0,4 |
| 14 | United Kingdom | 8,22 | 6 | 1,43 |
| 15 | Israel | 7,97 | 5 | 0,12 |
| 16 | USA | 7,61 | 5 | 1,15 |
| 17 | Austria | 7,61 | 5 | 0,59 |
| 18 | Hong Kong | 7,28 | 7 | 2,63 |
| 19 | Portugal | 6,97 | 5 | 1,02 |
| 20 | France | 6,66 | 5 | 0,6 |
| 21 | Japan | 6,57 | 7 | 1,09 |
| 22 | Costa Rica | 6,45 | 4 | 1,73 |
| 23 | Chile | 6,05 | 6 | 0,51 |
| 24 | Spain | 5,9 | 6 | 1,82 |
| 25 | Greece | 5,35 | 6 | 2,42 |
| 26 | Belgium | 5,25 | 6 | 3,28 |
| 27 | Czech Republic | 5,2 | 5 | 0,22 |
| 28 | Hungary | 5,18 | 6 | 1,66 |
| 29 | Poland | 5,08 | 5 | 2,13 |
| 30 | Italy | 5,03 | 6 | 2,07 |
| 31 | Taiwan | 5,02 | 7 | 0,76 |
| 32 | Malaysia | 5,01 | 6 | 0,5 |
| 33 | South Africa | 4,95 | 6 | 3,08 |
| 34 | South Korea | 4,29 | 7 | 2,76 |
| 35 | Uruguay | 4,14 | 4 | 0,63 |
| 36 | Brazil | 3,56 | 6 | 0,49 |
| 37 | Romania | 3,44 | 4 | 0,07 |
| 38 | Turkey | 3,21 | 6 | 1,21 |
| 39 | Thailand | 3,06 | 6 | 0,14 |
| 40 | Philippines | 3,05 | 6 | 0,51 |
| 41 | China | 2,88 | 6 | 0,82 |
| 42 | Argentina | 2,81 | 6 | 1,24 |
| 43 | Vietnam | 2,79 | 4 | 0,26 |
| 44 | Venezuela | 2,77 | 5 | 0,51 |
| 45 | India | 2,75 | 7 | 0,23 |
| 46 | Indonesia | 2,72 | 6 | 0,18 |
| 47 | Mexico | 2,66 | 5 | 1,18 |
| 48 | Pakistan | 2,53 | 4 | 0,47 |
| 49 | Russia | 2,27 | 6 | 0,87 |
| 50 | Colombia | 2,23 | 6 | 0,61 |
| 51 | Bolivia | 2,05 | 4 | 0,86 |
| 52 | Nigeria | 1,76 | 4 | 0,16 |